Inequality Was Increasing Before Trump
The Federal Reserve Board, the bankers’ bank, has put out figures and reports showing that even before the Trump regime, the rich were acquiring a larger share of the nation’s total income and wealth. The September 2017 Federal Reserve Bulletin reports that “the distribution of income and wealth has grown increasingly unequal in recent years.”1 Other government reports show that many continue to live in poverty and lack shelter and an adequate amount of food.
Government tables and findings undercut any claim that the Obama administration brought about a movement toward greater equality, as the “liberal” Nobel prize-winning economist Paul Krugman declared in a 2016 New York Times column. Said Krugman, “We expected good news [from newly released Census Bureau reports] but last year, it turns out … that a government that wants to can make American society more equitable, improving the quality of life for ordinary families.”2
Below is an examination of recent Federal Reserve Board information on the income and wealth distribution in the United States, followed by a look at government reports on poverty, homelessness, and food insecurity. Together, they show that the United States is not becoming a more equitable society.
The authors of the Federal Reserve Board article rely on statistics from the Survey of Consumer Finances (SCF) that “indicate that the shares of income and wealth held by affluent families have reached historically high levels since the modern SCF began in 1989.”3
Growing Wealth Inequality
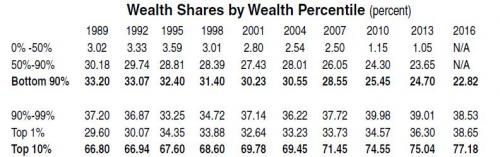
What may be the most crucial measurement of inequality is the distribution of wealth—the value of one’s assets minus what one owes. The table below, derived from the Federal Reserve Board, shows that the rich have been amassing a greater share of the nation’s wealth since 1989.4
From 1989 to 2016, the share of the nation’s total wealth held by the top 1 percent steadily increased by over nine percentage points, from 29.60 percent to 38.65 percent. During that time, those in the bottom 90 percent experienced a decline of more than 10 percentage points. This indicates that the growth in the share owned by the top 1 percent came at the expense of the bottom 90 percent. The poorest 50 percent experienced a decline in their share of the nation’s wealth from 1989 to 2013 of almost two-thirds, to a measly 1.05 percent.5
Wealth inequality took off during the “recovery” from the great recession. From 2010 to 2016, the share of wealth held by the wealthiest 1 percent went up over 4 percentage points, increasing more rapidly than previously. This increase alone was more than three times the total share of wealth held by the least well-off 50 percent in 2010 (1.15 percent).
The changes in the share-of-wealth percentages indicate that if the total U.S. wealth remained constant from 2010 to 2016 at $88.1 trillion (as it was estimated to be in the first quarter of 2016), the wealth held by the richest 1 percent increased from $30.46 trillion to $34.05 trillion over that time, or by more than $3.5 trillion in just six years—almost $600 billion per year.6
With the recent rise in the stock market, wealth inequality has likely increased from where it was in 2016. It will presumably further increase as a result of the Republican tax bill.7
Growing Income Inequality
The Federal Reserve Board report announces, “Families at the top of the income distribution saw larger gains in income between 2013 and 2016 than other families, consistent with widening income inequality.”8
Below is the fed’s table on the distribution of income.9
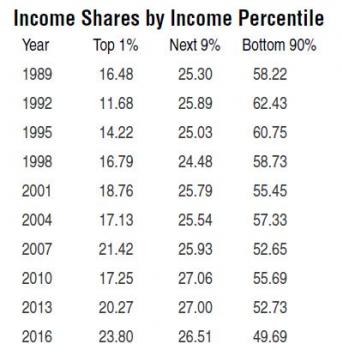
The general trend from 1992 to 2016 has been one of growing income inequality. The share of total income going to the top 1 percent more than doubled, from 11.68 percent to 23.8 percent, up over 12 percentage points, while the share of the bottom 90 percent declined by even more, almost 13 percentage points. This means that the growing share of income going to those in the top 1 percent came at the expense of the bottom 90 percent of the U.S. population. This comes as no surprise, given the weakness of organized labor, hostile government policies toward workers, and the greater job insecurity many workers face.
Surprisingly, from 1989 to 1992, during the Republican Bush Sr. administration, there was a movement toward greater income equality. The share of total income going to the top 1 percent declined by almost a third, with most of that decline benefitting the 90 percent with lower incomes.
Since 1992, the trend of growing income inequality was only interrupted by a mild recession during the beginning of the Bush Jr. regime and, more dramatically, by the great recession starting in December 2007. From 2007 to 2010, the top 1 percent experienced a drop in their share of the country’s income by more than 4 percentage points.
However, as the economy “recovered” from the great recession, the 1 percent of the population with the largest income saw their share go up from 17.25 percent in 2010 to 23.80 percent in 2016, an increase of more than one-third, while the bottom 90 percent’s share of the total income declined. Additionally, for the first time, more than half of total income went to the top 10 percent.
Ironically, in this era, when there are recessions, there is a simultaneous movement toward income equality! And when the economy begins to grow again, income inequality increases.
In these measures of wealth and income inequality, what is absent is a presumed decline in what the bottom 90 percent can purchase with their income and wealth, and receive in social wages. The latter can be defined as the value of benefits resulting from government programs. Even if one’s income increases, one can be less well-off if programs from which one benefits are cut or eliminated, or if one has to pay higher fees for government services. This decline in one’s social wage can result from higher charges for public transportation, tolls, entry fees at state and national parks, and tuition to attend state colleges or to pay for after-school programs that once were free. Additionally, the reduction of government services, ranging from tax help to fixing potholes, has further contributed to an individual’s costs going up, and to a decline in social wages.
The Situation of
the Most Deprived
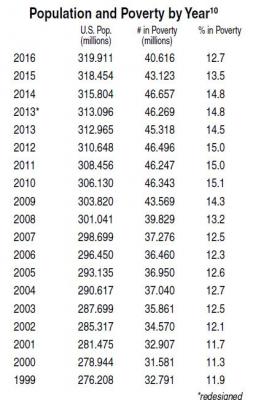
While the country’s total wealth has increased, government figures on poverty indicate that eight years after the start of the great recession, more than 40 million people remain impoverished, more than at any time when Bush Jr. was in power. (In part, this is due to population growth.)
During the Obama administration, the lowest percent of those officially living in poverty came in his last year in office, when there was a significant decline in the rate of poverty from 14.8 percent in 2014 to 12.7 percent in 2016. Before 2016, the rate of poverty during each year of the Obama administration was higher than during any year of the Bush regime, including 2008, the first year of the great recession.
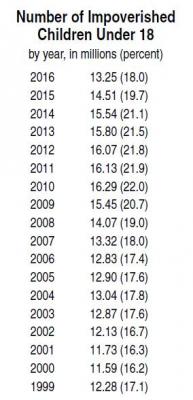
Of great concern is the number of children under 18 deemed to be living in poverty. That number was over 13 million every year during Obama’s presidency. Until 2016, the percent of impoverished children was higher than for every year Bush was in office.11
The poverty numbers mask other problems. In 2016, according to a Department of Housing and Urban Development report, more than 549,928 people were homeless, of which 120,819 were children under 18 years of age.12 Most homeless children were classified as sheltered, which is defined as “people who are staying in emergency shelters, transitional housing programs, or safe havens.” However, 11,953 were unsheltered, defined as “people whose primary nighttime location is a public or private place not designated for, or ordinarily used as, a regular sleeping accommodation for people (for example, the streets, vehicles, or parks).”13
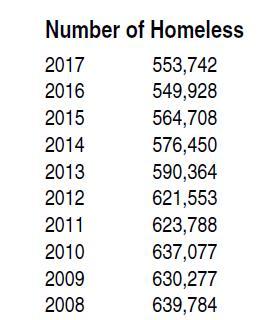
The number of homeless people increased from 2016 to 2017 by more than 3,800, perhaps an indication of what is to come. One has to wonder what will happen when there is a downturn in the economy.
From 2010 to 2016, there was a decline in the homeless population, which fell an average of more than 14,500 a year. If a decline at that rate were to have continued, we would have to wait over 36 years for homelessness to be eliminated.
The lower size of the homeless population in 2016 does not reflect a less alarming problem: More of the homeless are unsheltered. That number rose by 3,089, from 173,268 in 2015 to 176,357 in 2016, and by an additional 16,500 in 2017.14
Food Insecurity
Food insecurity is another serious problem. According to a Department of Agriculture report,
In 2016, 12.3 percent of U.S. households were food insecure—meaning that they had difficulty at some time during the year providing enough food for all their members because of a lack of resources. That level is essentially unchanged from 2015, but down significantly from 14.0 percent in 2014.
… Food-insecure households can be separated into those with low or very low food security. In 2016, 4.9 percent of all U.S. households experienced very low food security, also unchanged from 2015. In this more severe range of food insecurity, the food intake of some household members was reduced, and normal eating patterns were disrupted, at times during the year because of limited resources.
Food insecurity and very low food security rose markedly during the 2007-09 recession. In 2007, 11.1 percent of U.S. households were food insecure, and 4.1 percent experienced very low food security. Since peaking in 2011 at 14.9 percent, food insecurity has declined but remains higher than the pre-recession level. Similarly, very low food security rose to 5.7 percent in 2008 and 2009. In 2010, very low food security declined to 5.4 percent and was essentially unchanged from 2011 through 2014. Very low food security declined from 5.6 percent in 2014 to 5.0 percent in 2015.15
Those with a low income face worse food insecurity. In 2016, 35.7 percent of households with incomes below 130 percent of the poverty line were food insecure, which is almost triple the rate of food insecurity among the total population (12.3 percent).16
As of 2016, before the Trump presidency, according to another Department of Agriculture publication, the level of food insecurity among children was near the level before the start of the great recession:
Children were food insecure at times during the year [2016] in 8.0 percent of U.S. households with children (3.1 million households), essentially unchanged from 7.8 percent in 2015. These households were unable at times during the year to provide adequate, nutritious food for their children. As in 2015, the 2016 prevalence of food insecurity among children was near the pre-recession level of 8.3 percent in 2007.17
Liberal Distortions
What kind of wealthy society allows thousands of people, especially children, to go hungry and to lack the security of a home?
In his September 16, 2016, New York Times column, Nobel Prize-winning economist Paul Krugman wrote that, based on recent Census Bureau reports on income, poverty, and health insurance, we had “good news” in 2015 that included “a substantial decline in the poverty rate,” and median income rose “a remarkable 5.2 percent.”18
Was there really “good news”? Krugman admits that the “surge in median income comes after years of disappointment,” and that median income is still lower than it was before the great recession.
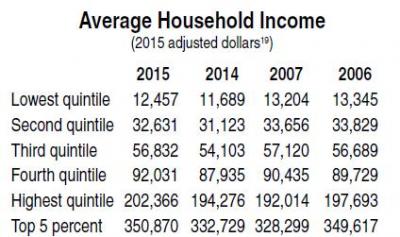
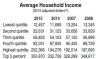
Above are Census Bureau figures upon which he presumably drew, covering average income of people in various income quintiles (each representing 20 percent of the population). This may provide a more accurate picture than simply median income.
These figures show that when comparing average incomes of 2006 and 2007 (before the great recession) with 2015, the average incomes of the lowest-earning 40 percent were less in 2015 than in 2006 or 2007. By contrast, those in the top 40 percent have higher average income in 2015 than 2006 and 2007, which indicates a greater degree of income inequality.
The average household income of each of the bottom three quintiles (60 percent of the population), grew in a range from 4.8 percent to 6.6 percent from 2014 to 2015, while the top 5 percent’s income grew 5.4 percent. When those with a lower income have a similar or greater rate of growth as those with a higher income, total income inequality can, nevertheless, increase. For example, the lowest quintile had a 6.6 percent growth in income, $768, from 2014 to 2015. The top 5 percent had a lower rate of growth at 5.4 percent, but their income increased by $18,141. That resulted in widening the income inequality between these two groups, from an average of $321,040 in 2014 to $338,413 in 2015.
In 2016 (using 2016 dollars) the gap increased more dramatically, as the top 5 percent experienced an average income increase of more than $19,000 while those in the lowest quintile saw their average income increase by $329.
Taxes Under Obama
Krugman writes that there is “a grain of truth” to the Republican “accusation” that Obama is a “redistributionist.” The tax rates of the rich did go up. However, Krugman does not point out that this has not dampened their increasing share of wealth and income, resulting in greater inequality. Their increasing income may have more than offset their higher taxes, leaving them with far greater after-tax income than before the new tax rates.
More importantly, the increasing value of the wealthy’s assets, with few exceptions such as real estate, are not subject to any taxes unless sold at a gain, or, after they die in the form of estate taxes (assuming they have not found a shelter from this tax).
Krugman concludes that the “progressive policies [of the Obama administration] have worked.” One has to wonder what is the meaning of progressive policies since, according to the government, at the end of the Obama administration, wealth and income inequality were greater; more than 40 million people, including more than 13 million children, remained impoverished; easily more than 540,000 people were homeless; and more than 15 million households were food insecure during the year before the full and nasty effects of what Trump and the Republican gang will “accomplish.”
Krugman’s claim that the Obama administration made “American society more equitable” is baffling.
In a 2017 column entitled “The Republican War on Children,” Krugman rightfully criticizes the Republican tax plan. He points out that the actions of Republicans show “that they consider it more important to give extra millions to one already wealthy heir than to provide health care [by funding the Children’s Health Insurance Program] to a thousand children.”20
Krugman goes on to write that “simple decency” is reason enough for “providing children with health care and enough to eat,” and “it’s still hard to believe that a whole political party would balk at doing the decent thing for millions of kids while rushing to further enrich a few thousand wealthy heirs.”
Wish he had said the same on behalf of the thousands of homeless and food-insecure children when Obama was president. Wasn’t that administration’s failure to forcefully speak out and fight vigorously to do “the decent thing for millions of kids” indecent?
Too often, there is a celebration of those with great fortunes, especially if they set up foundations and engage in what is characterized as philanthropic activities. One such person is Bill Gates, whose wealth was recently estimated to be as much as $90 billion—enough money to provide each of the 553,742 homeless people in the United States in 2017 with over $162,000.21
There is a contention that “behind every great fortune lies a great crime.” If true, should one characterize the increasing size of great fortunes as great crimes becoming even greater? Is the United States “free-market” system generating ongoing social criminality by allowing a large part of its population to live in poverty and lack adequate food and shelter while an increasing share of wealth and income are ending up in the pockets of the richest among us? These are trends that Trump is helping to continue, but did not initiate.
Footnotes
1. September 2017 Federal Reserve Bulletin: Changes in U.S. Family Finances from 2013 to 2016: Evidence from the Survey of Consumer Finances, 10.
2. Paul Krugman, “Obama’s Trickle-Up Economics,” New York Times, Sept. 16, 2016. The title is appropriate because there was a trickle-up during Obama’s time in office.
3. September 2017 Federal Reserve Bulletin, 10.
4. The 0-50 percent is found here. The bottom 90 percent, top 1 percent, and next 9 percent are found here, at Box 3.
The 50-90 percent figure is arrived at by subtracting the bottom 50 percent from the bottom 90 percent. For 2016, I have not found a figure for the bottom 50 percent. Perhaps that figure is now negative, given that the drop of the bottom 90 percent from 2013 to 2016 was almost 2 percent, much more than the holdings of the bottom 50 percent as of 2013, which were 1.05 percent of the nation’s total wealth.
Note: Rounding results in totals slightly above or below 100 percent. Some totals from the first source above are slightly different than the second source.
5. Noteworthy is that wealth inequality is far greater than income inequality. For example, as of 2016, the share of the nation’s wealth held by the richest 1 percent stood at over 38 percent, while the share of income of the top 1 percent is less than 24 percent.
6. Kerry Close, “Americans’ Total Wealth Reaches Record High,” Money, June 9, 2016.
According to a Federal Reserve report, the share of wealth held by the top 0.1 percent has also grown greatly. In 1989, it stood at 10.8 percent of all wealth, reaching 14.2 percent in 2013. During that time, the total holdings of the top 1 percent grew by 6.7 percent of total wealth. The increase in the share of the top 0.1 percent accounted for over half of the increase of the top 1 percent.
From 2010 to 2013, the holdings of the top 0.1 percent grew 1.4 percent, which is over 80 percent of the growth of the entire top 1 percent (1.73 percent).
See Adam Looney and Kevin B. Moor, “Changes in the Distribution of After-Tax Wealth: Has Income Tax Policy Increased Wealth Inequality?”, 2015, 24.
7. See The Guardian, “World’s Richest 500 See Their Wealth Increase by $1 Trillion This Year,”
8. The Guardian, 1.
9. See Federal Reserve Bulletin, 2017 Volume 103, "Changes in US Family Finances from 2013 to 2016: Evidence Finances", Box 3, Figure A.
10. Figures from U. S. Census Bureau, Income and Poverty in the United States: 2016, 44.
One might question the guidelines for determining who is living in poverty. Labeling one as living in poverty is based on one’s income. In 2016, for single people under 65 years of age to be considered impoverished, their income must be under $12,486, while a household with two adults and two children is considered impoverished if total income is under $24,339 (see page 43). In many major urban areas, the poverty threshold income does not even cover the typical cost of rent.
11. U.S. Census Bureau, 50.
12. U.S. Department of Housing and Urban Development, The 2017 Annual Homeless Assessment Report to Congress, 8 (for homeless population), 10 (for homeless children); and The 2016 Annual Homeless Assessment Report to Congress, 8, 10.
See also, The Guardian, "America Homeless Population Rises for the First Time Since the Great Recession"
13. U.S. Department of Housing and Urban Development; and for definitions see pages 2 and 3.
14. U.S. Department of Housing and Urban Development, 8, 9. See also The 2015 Annual Homeless Assessment Report to Congress.
15. U.S. Department of Agriculture, Understanding the Prevalence, Severity and Distribution of Food Insecurity in the United States, Sept. 6, 2017.
16. U.S. Department of Agriculture, Understanding Food Insecurity, and U.S. Department of Agriculture, Statistical Supplement to Household Food Security in the United States in 2016, Sept. 2017, 2.
17. U.S. Department of Agriculture, Household Food Security in the United States in 2016, Sept. 2017, 1.
18. Krugman, “Obama’s Trickle-Up Economics.” See also U. S. Census Bureau, Income, Poverty and Health Insurance Coverage in the United States: 2015, Sept. 13, 2016, 23.
19. All figures shown can be found on page 31 of each of: U. S. Census Bureau, Income and Poverty in the United States 2015, Sept. 2016; and U. S. Census Bureau, Income and Poverty in the United States 2016, Sept. 2017.
20. Paul Krugman, “The Republican War on Children,” New York Times, Dec. 7, 2017. Krugman writes about how the Republicans are cutting taxes on the rich, including the estate tax that currently brings in about $20 billion a year, but they can’t find the money to continue financing the Children’s Health Insurance Program that costs $15 billion a year and helps create what are “likely to be healthier and more productive adults.”
Note: The CHIP program was funded in the beginning of 2018 after the tax bill was enacted.
21. See Bloomberg Billionaire Index, Dec. 29, 2017. There are various estimates of Gates’ wealth and how much it increased. This article puts Gates’ wealth at $84.5 billion.